Bacteria pie charts learning activity
This resource is available for free download
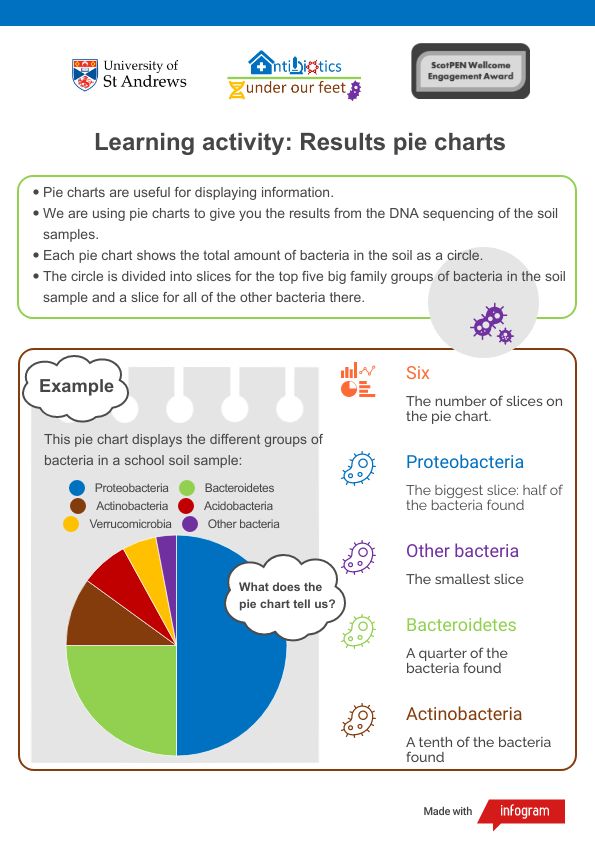
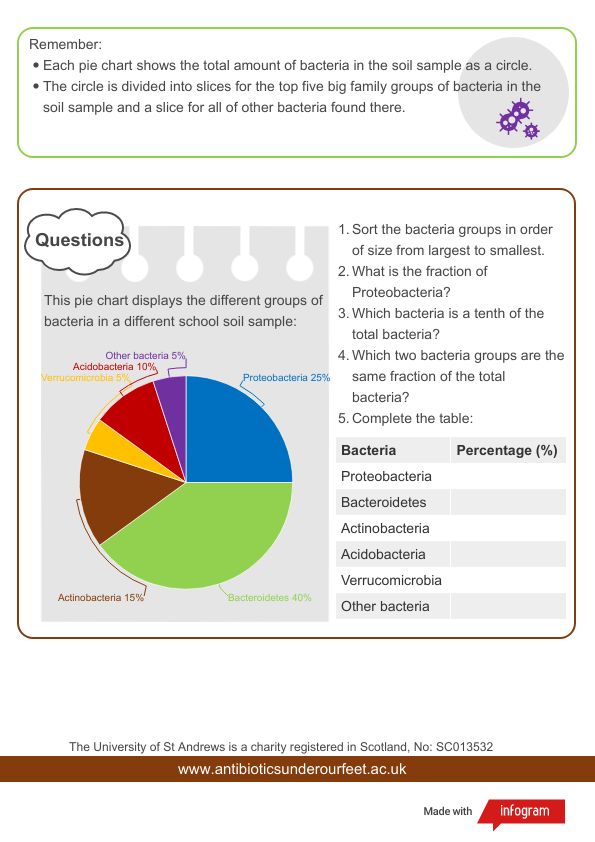
Results for the bacteria in each soil sample will given on our interactive map and on our scientific results page as pie charts showing the top five phyla (big family groups) of bacteria present. Find out more about the bacteria groups by following the links given below.
Firmicutes are a known source of antibiotics so we will tell you if bacteria from this family group are present (check the “other bacteria” category if it’s not in the top five). Streptomyces is a “genus” in the family group Actinobacteria – this is a good source of antibiotics too so look out for Actinobacteria in our results!
In our pilot study, we found the same top five phyla of bacteria in all soil samples: Proteobacteria, Bacteroidetes, Actinobacteria, Acidobacteria and Verrucomicrobia
Firmicutes were also present but in very small amounts. Will this be the same for our project soil samples? Will the same bacteria be in the top five? Will the fractions change? We will need your help with the results! We’ve already spotted some Planctomycetes. What else might be in there?
You may find it helpful to download and print the bacteria names and results table for use with this learning activity and for analysing our results. There are two versions of each included: one with the common bacteria present in our pilot study listed and a blank version. The bacteria names can be cut out and used to help sort the groups in order of amount present in the soil sample. Answers to the questions are provided!
When you have completed this activity, you will be ready to interpret the DNA sequencing results on our interactive map.